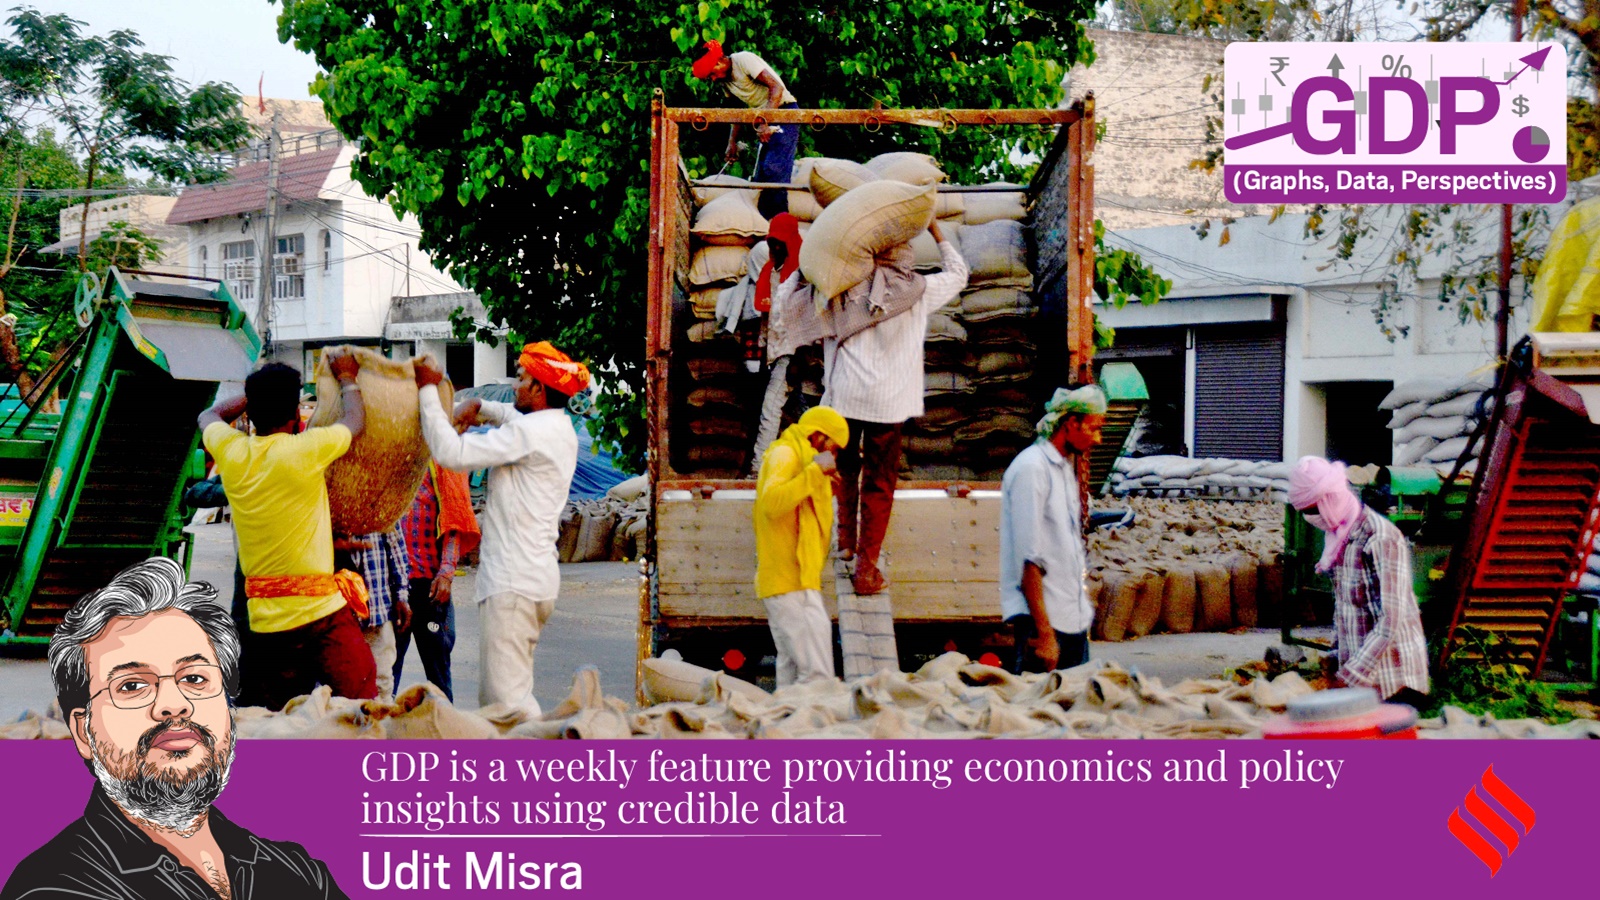
 At a daily earning of Rs 453 in 2025-26, a casual labourer working all 30 days would have still earned only Rs 13,590 a month. (Express photo by Harmeet Sodhi)
The United States and Israel’s war on Iran and the resultant spike in prices of crude oil and other products critical to the smooth functioning of the global economy have made inflation the main worry for policymakers across the world.
Between June 3 and 5, the Monetary Policy Committee of India’s Reserve Bank of India (RBI) will deliberate on this matter. For its part, the Union government has as yet shielded average consumers in India from the full effect of the rise in international prices.

But while policymakers are focussed on containing the inflation rate, average consumers in India focus more on affordability. The notion is best captured in the worries of several consumers, who bemoan that “once prices go up, they never come down”.
In other words, consumers are often more worried about the cumulative effect of past price increases on their household budgets and overall affordability than just the inflation rate in a particular month. This difference between the two ideas is also at the heart of the so-called “affordability crisis” in the US and the cost-of-living crisis in the UK. In both countries, affordability, more than just the inflation rate, is also leading voters to change their political choices.
What’s the difference between inflation and affordability?
The inflation rate is the rate at which the general price level rises from one year to another.
Every country has chosen a representative basket of goods and services that its consumers use, and it tracks how the prices for this basket move. The year-on-year increase in this general price level is called the “headline” inflation rate, the one commonly referred to in policy debates.
Of course, some goods and services might have witnessed higher inflation than the headline number, and some lower. As Chart 1 shows, since the RBI adopted a policy regime to target a specific level of inflation in 2016, India’s inflation rate has been within the RBI’s comfort zone of 2% to 6% (red lines), even if it stayed above the target rate of 4% (blue line). More importantly, over the past three years, the RBI has successfully brought down the inflation rate from almost 7% to around 2%.
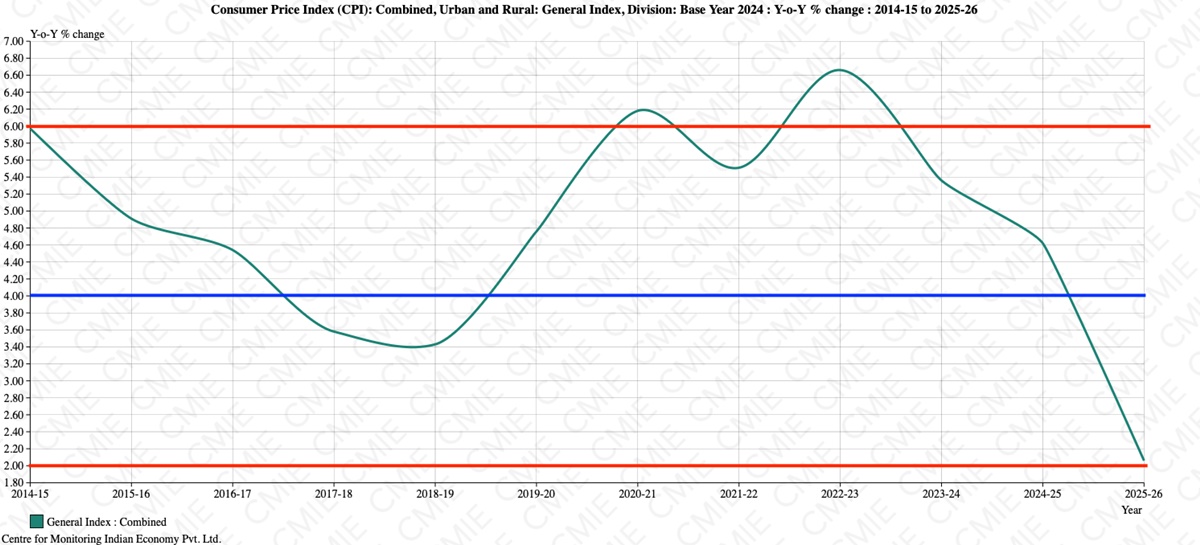 CHART 1 on inflation.
The worry for policymakers now is that the blockade of the Strait of Hormuz is likely to push up the inflation rate for the current financial year (2026-27) closer to 5%.
The consumers, on the other hand, are more bothered about affordability, which, in turn, depends on two broad factors:
*the cumulative effect of repeated inflation spikes on the general price level
*the growth in their incomes relative to the rise in the general price level
In other words, consumers effectively care more whether they are better-off or worse-off in “real” terms — that is, after the effect of inflation is neutralised both from prices and incomes.
How to know whether you are better- or worse-off in real terms?
Did your income growth keep pace with the increase in the general price level? Chart 2 provides a simple test.
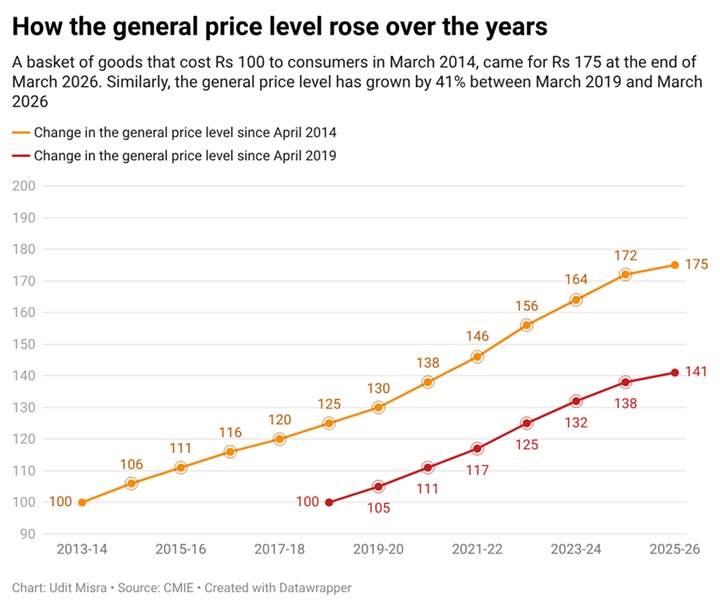 CHART 2 on affordability.
Let’s assume the general price level as of March-end 2014 (the end date for financial year 2013-14) was 100, around the beginning of the first term of the current NDA government. If one then applies the annual inflation rates to this, one can arrive at the price level at the end of March 2026. As the data shows, it is 175.
In other words, a basket of goods and services that cost Rs 100 to consumers in March 2014, cost Rs 175 at the end of March 2026.
One way to assess whether one is better- or worse-off since the start of April 2014 is to compare incomes. If their income has gone up by 75%, then one is exactly where one was 12 years ago in “real” terms. If their income has grown by a lesser degree, then one is worse-off in real terms, and if the income has grown by a higher percentage, then one is better-off to that extent.
Similarly, the general price level has grown by 41% between March 2019 and March 2026. Similar calculations can be made for those who started working at the start of April 2019 (around the second NDA term), albeit the key number is 41% in this case.
What about the rest of India?
The Ministry of Statistics and Programme Implementation (MoSPI) releases regular Periodic Labour Force Surveys (PLFS) that map employment, unemployment and income data. The PLFS divides the whole workforce into three categories of workers:
1. Salaried (regular wage earners)
2. Self-employed (e.g., small vendors)
3. Casual labour (e.g., those working on construction sites)
However, for reasons of data comparability, the only period for which one can get a representative picture is between 2017-18 and 2023-24. Still, it provides a sense of how India fared during this period in terms of affordability. Of course, it is possible that the picture may have changed since then, but exactly comparable data is not available as of now.
Chart 3 marks everything — from incomes to price level — down to 100 at the end of March 2018, and then shows how incomes of different types of workers grew relative to the increase in price level.
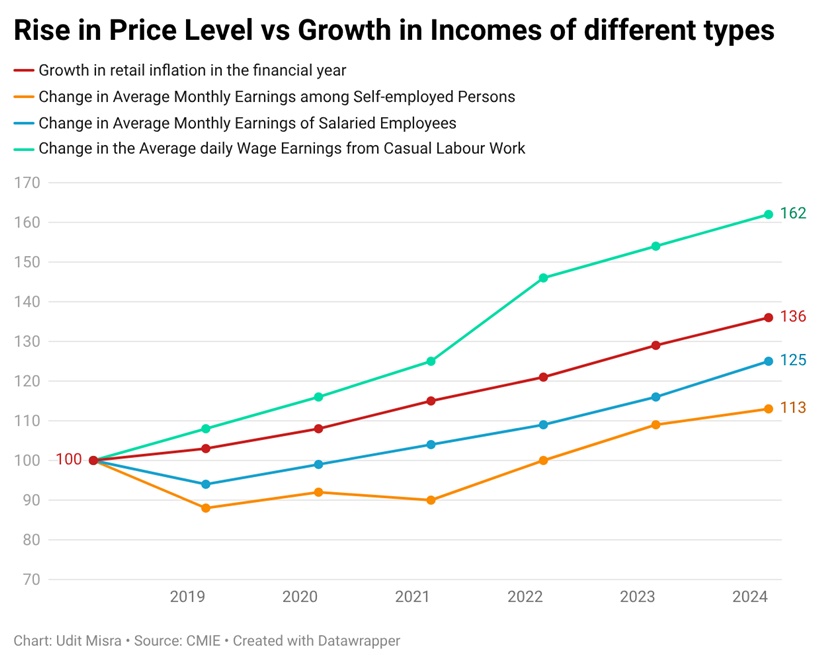 CHART 3 on inflation vs incomes.
What it shows is that growth in incomes of the salaried and the self-employed lagged behind the rise in the price level. In other words, in real terms, they became worse off during this period. The daily wages of casual labour, however, grew faster than the general price level.
It is noteworthy that casual labourers actually earn the lowest in absolute terms among the three categories. For instance, at a daily earning of Rs 453 in 2025-26, a casual labourer working all 30 days would have still earned only Rs 13,590 a month, while the self-employed earned Rs 14,861 per month and salaried workers earned Rs 22,699 per month.
Moreover, as Chart 4 shows, over this period, the share of self-employed — the category worst-off in terms of affordability — grew rapidly while the shares of the other two categories declined.
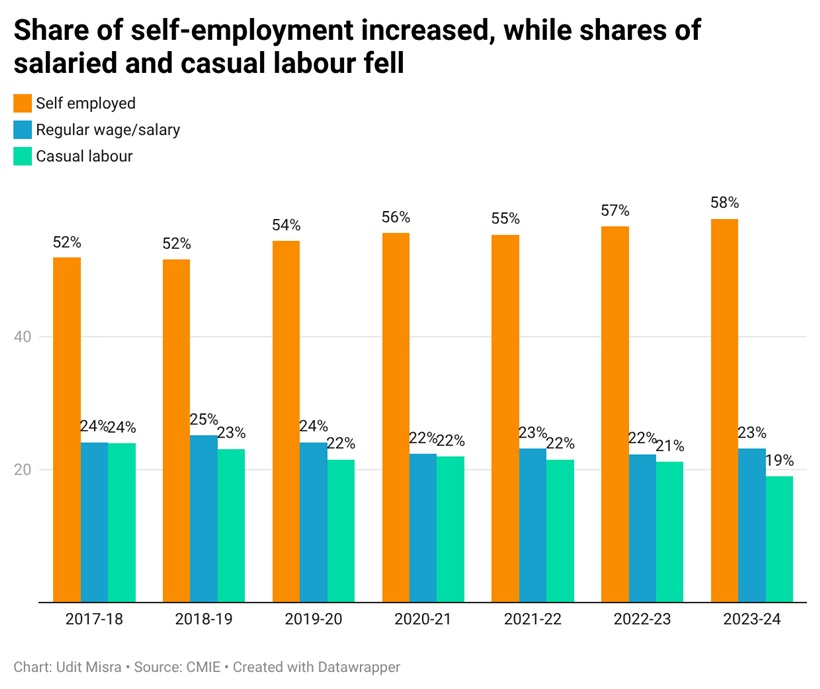 CHART 4 on shares of different types of employment.
So, how can RBI help matters?
The RBI cannot directly do much about the income growth of different workers. That depends on a whole host of factors outside its scope.
On the inflation front, too, the RBI can’t address the main reason for inflation: inadequate crude oil supply. Under the circumstances, all that the RBI can do is to constrain overall demand for goods and services among consumers by raising interest rates. Higher interest rates would slow down economic activity by making loans (be it for cars, homes or factories) costlier.
In other words, if RBI wants to arrest inflation, it will have to drag down India’s economic growth; an action that mirrors what the government is doing by raising fuel prices and urging people to consume less.
